
Society
Health Management
Employee Health and Well-being at Aisan Industry
Aisan Industry promotes employee health and well-being with safety, health, and diversity as key management foundations. By supporting the physical and mental well-being of all employees and enhancing job satisfaction, we strive to create a safe, inclusive, and thriving workplace where everyone can perform at their best.
Based on analyses of health-related challenges, we make strategic investments in employee health and encourage positive behavioral change through initiatives designed to improve health literacy and foster a culture of health throughout the organization. We continuously monitor key indicators, including presenteeism, absenteeism, and work engagement, and use the results to drive ongoing improvement.
At our overseas group companies, we implement health screenings, vaccination programs, and other preventive measures against infectious diseases. We also address region-specific health risks, including malaria and tuberculosis, through appropriate health and safety initiatives. These efforts help safeguard employee health and well-being while contributing to broader global health objectives.
In addition, we collaborate with domestic and overseas group companies, business partners, and other stakeholders to share best practices and employee well-being initiatives. By promoting health and safety throughout the supply chain, we aim to enhance both social and corporate value and contribute to the sustainable growth of society and business.
Health Declaration
Health Challenge
Aisan believes that the physical and mental health of each employee is essential for maximizing individuality and talent, thereby promoting job satisfaction and corporate revitalization. Based on the fundamental principles of respect for humanity and health first—both being cornerstones of our endeavors as a company—we continue to evolve our health maintenance and promotion activities. We further support the health of our employees and their families by actively promoting health challenges in collaboration with the company, labor union, and health insurance association.
Furthermore, we hereby declare our commitment to the creation of healthy and vibrant communities and societies through our business activities.
June 16, 2026
President
Takami Kato

Health and Productivity Management Strategy Map
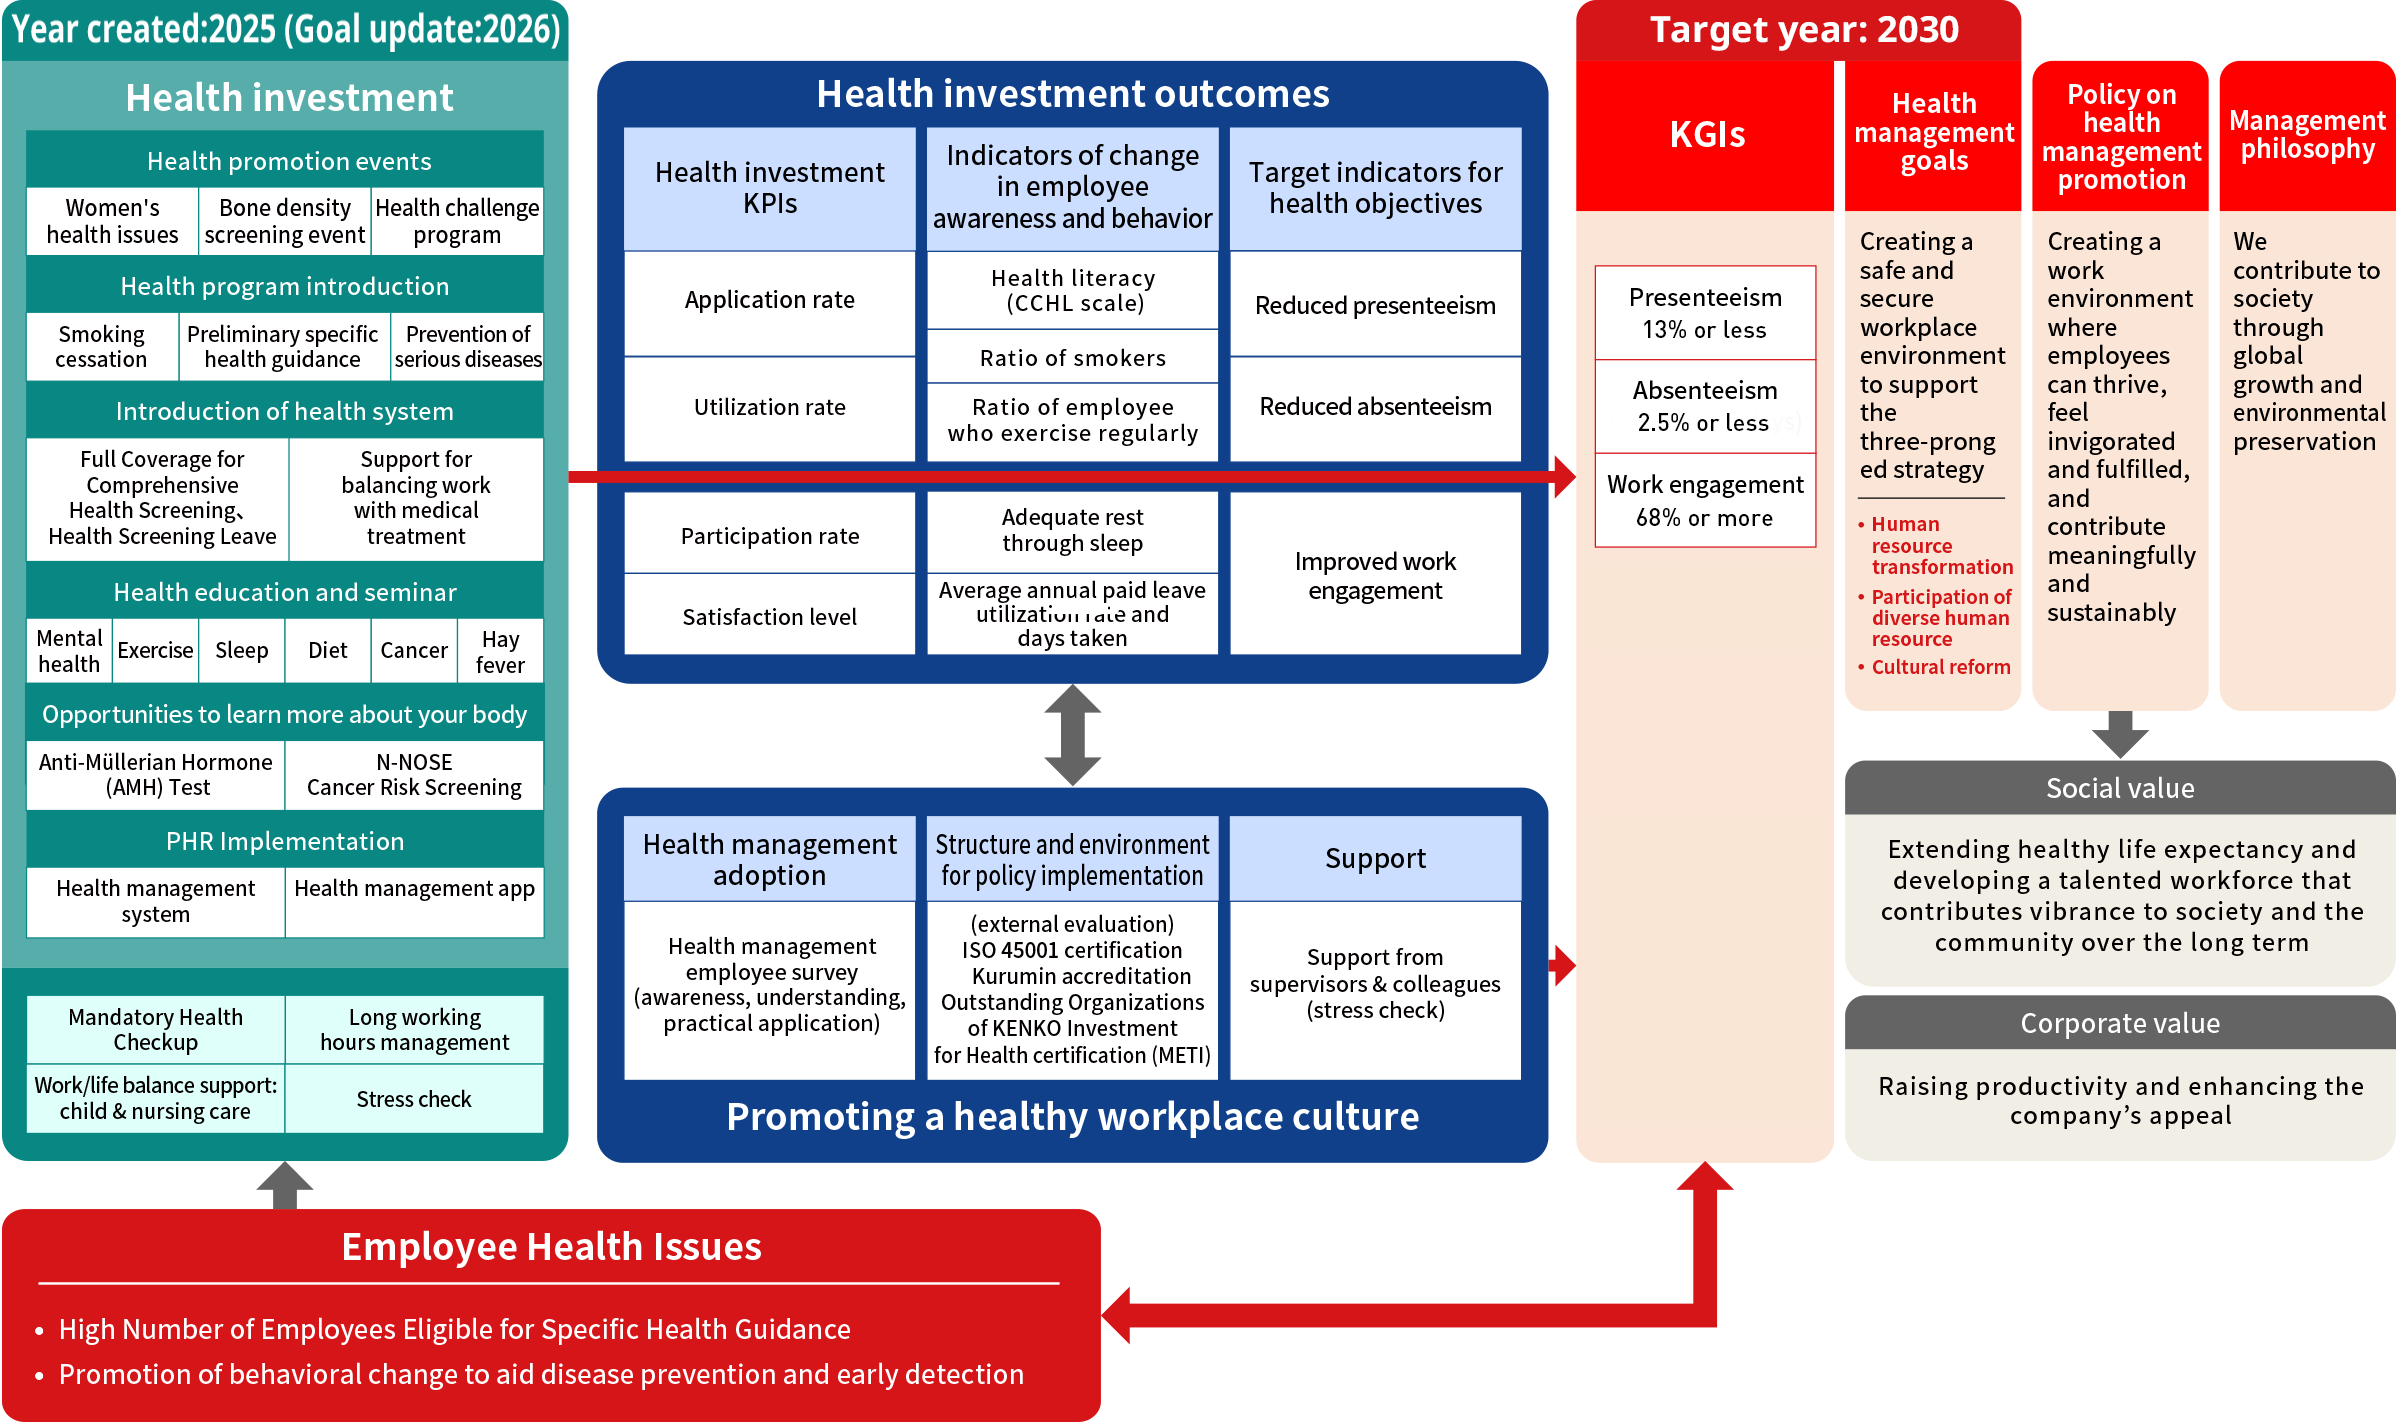
This image can be enlarged by pinching out
Health and Productivity Management KPI
KPIs (business performance) for overall health management
| Fiscal 2022 results | Fiscal 2023 results | Fiscal 2024 results | Fiscal 2025 results | Fiscal 2030 targets | ||
|---|---|---|---|---|---|---|
| Presenteeism |
SPQ
Response rate / number of respondents
|
17% 54.8%・1,632 |
18% 65.1%・1,893 |
17% 58.6%・1,793 |
16% 96%・2,994 |
13%or less |
|
Absenteeism
|
Utilization Rate
Average days of sick leave
Number of cases
Average number of health insurance subscribers per fiscal year |
3.5% |
3.2% 2.0 3,092 |
3.2% 1.4 3,091 |
3.4% 2.1 3,013 |
2.5or less (Average number of days: 1.6) |
|
Work engagement
|
Positive Response Rate
|
50% | 53% | 52% | 52%※1 |
68% or more |
- Presenteeism: Single-Item Presenteeism Question (SPQ), University of Tokyo 1-item version
- Absenteeism: Average days of sick leave per person (total days used)
- Work Engagement: Calculated as the average positive response rate from three questions (Vitality, Enthusiasm, and Immersion) in an employee engagement survey conducted using Qualtrics
Key health management metrics
| Fiscal 2021 results | Fiscal 2022 results | Fiscal 2023 results | Fiscal 2025 targets | |
|---|---|---|---|---|
| Regular health checkup participation rate | 98.4% | 98.9% | 99.3% | 100% |
| Ratio of employees receiving comprehensive medical checkups | 66.9% | 73.6% | 76.4% | 90% |
| Advanced examination participation rate (follow-up examinations) | 89.4% | 89.1% | 84.0% | 95% |
| Stress check implementation rate | 93.8% | 93.3% | 94.7% | 98% |
Key health issue metrics
| Fiscal 2021 results | Fiscal 2022 results | Fiscal 2023 results | Fiscal 2025 targets | |
|---|---|---|---|---|
| Lipid risk score | 33.3% | 31.6% | 29.5% | 28% |
| Blood pressure risk score | 12.6% | 14.3% | 15.6% | 12% |
| Blood glucose risk score | 9.5% | 9.4% | 10.4% | 8% |
| Smoking rate | 26.1% | 24.9% | 24.0% | 20% |
| Regular exercise rate | 24.6% | 26.8% | 27.4% | 35% |